Gen AI is fluent; a Knowledge Graph makes it trustworthy
The Need
Most enterprises sit on oceans of documents, emails, tickets, spreadsheets, and app data. LLMs can read them—but they don’t know what’s true, how facts connect, or where evidence lives. That’s why answers can drift, contradict, or change with each prompt.
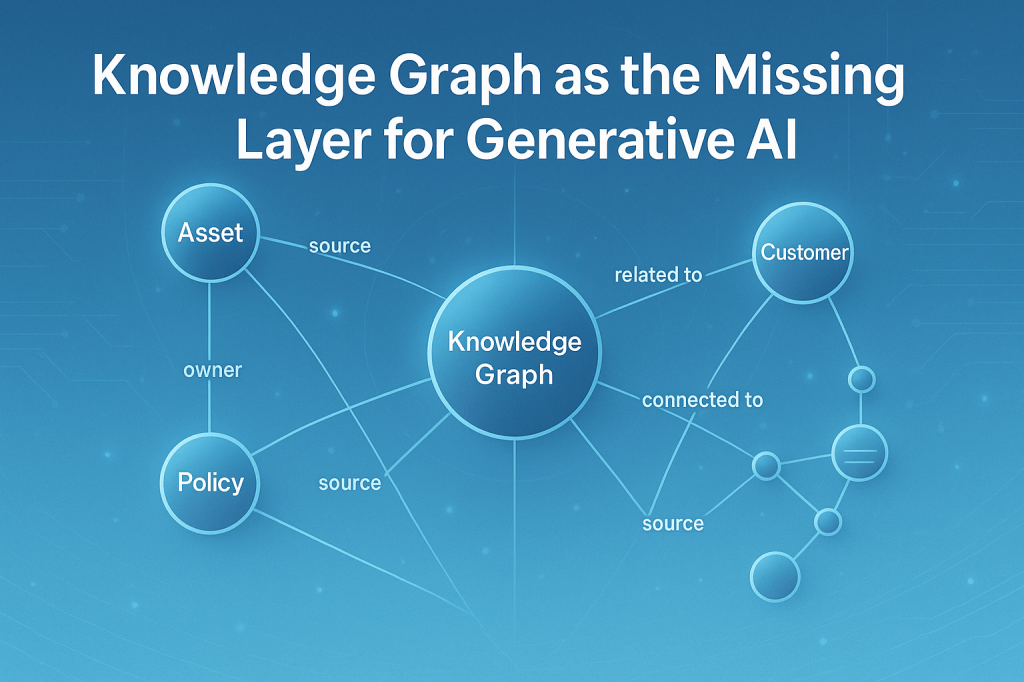
A Knowledge Graph (KG) fixes this by turning your core facts into a connected map: things (assets, sites, customers, policies) and relationships (part‑of, located‑in, qualifies‑for, depends‑on) with provenance (source, owner, timestamp). When Gen AI uses the graph as context, you get answers that are faster, consistent, and auditable.
Why KGs are a Key Component of Gen‑AI Solutions
- Grounded Answers – The graph provides verified facts and links; the LLM explains in natural language.
- Provenance & Compliance – Every statement can trace back to a clause, table, or system of record.
- Reusability Across Assistants – One KG powers Ops, CX, Finance, and Compliance assistants—no duplicate truth.
- Better Reasoning – Graph structure encodes dependencies, causality, and constraints (e.g., asset A depends on B).
- Lower Cost, Higher Control – Graph‑first retrieval (GraphRAG) narrows the context so prompts are smaller and cheaper.
- Interoperability – Reuse industry vocabularies; connect internal data with external sources (standards, public KGs).
- Evolvability – Add new nodes/edges without breaking schemas; update once, benefit everywhere.
Where a KG Supercharges LLMs (Industry Use Cases)
Utilities & Smart Buildings (B2B)
- Payback Planning: “Which retrofits hit <3‑year payback for UK schools?” → LED + BMS tuning, with payback math and sources.
- Asset Risk & Workpacks: “Which pumps are most at risk next quarter?” → Ranked list + recommended interventions, grounded in history and conditions.
- Regulatory Eligibility: “Which sites qualify for incentive X today?” → Eligibility graph built from policy PDFs + site attributes; assistant answers with citations.
Field Operations & HSE
- Permit‑to‑Work Reasoning: Graph of equipment, hazards, and procedures; assistant generates safe work instructions with referenced steps.
- Root‑Cause Trails: Link events, alarms, maintenance logs; LLM narrates the causal chain with evidence.
Energy Retail & Customer Ops
- Targeted Outreach: Eligibility + property + usage graph → who qualifies for heat‑pump grants; LLM drafts compliant messages with reasons.
- Tariff Advice: “What’s the best tariff for this segment?” → Graph joins consumption, contract terms, and constraints; assistant explains the trade‑offs.
Enterprise IT & ERP (SAP/ServiceNow)
- Process Intelligence: KG of O2C/P2P/M2C entities and events; LLM explains bottlenecks, anomalies, and improvement actions with traceability.
- Policy Q&A: “Can we backdate invoices for Region A?” → Answer grounded in policy graph + effective dates.
(Other domains: healthcare care‑pathways, manufacturing BoM/BoP, supply‑chain risk, financial KYC)
How to Build (Simple, Practical)
1) Start with 3–5 questions that matter. Define success metrics (accuracy, time‑to‑answer, citation rate).
2) Sketch a small schema (8–15 entity types; 10–25 relationships). Reuse existing vocabularies where possible. Keep it human‑readable.
3) Extract facts from high‑value sources. Use a mix of:
- Pipelines: named‑entity recognition, entity linking, relation/attribute extraction.
- Generative extraction: prompt an LLM to emit candidate triples + citations & confidence. Store source, owner, timestamp for each fact.
4) Validate like an auditor. Apply constraints (types, allowed values, units), detect conflicts, and route low‑confidence facts for review (SHACL + simple checks).
5) Load & query. Put the graph into a store (Jena/GraphDB/Stardog or Neo4j). Test key questions with SPARQL/Cypher.
6) Plug into GraphRAG. Retrieve a small, relevant subgraph + cited passages as the LLM’s context; generate the answer with sources.
7) Measure & iterate. Track precision, coverage, violations, answerability, and time‑to‑answer. Expand only when metrics look good.
Closing Thought
Don’t just make your AI talk—make it answerable. A Knowledge Graph is the layer that turns enterprise knowledge into grounded, reusable, and auditable intelligence. Start with one question, one graph, and let the value compound.

Leave a comment